Customization
Kibana Dashboard allows you to modify existing visualizations or create new one.
In this guide, you will learn how to add additional visualizations in your Kibana Dashboard with custom age groups.
Before you start, make sure that you have Kibana Dashboard and person visits data in your Nuitrack Analytics account. If you have no, then follow Getting Started Guide.
Create new visualization#
Open Kibana Dashboard.
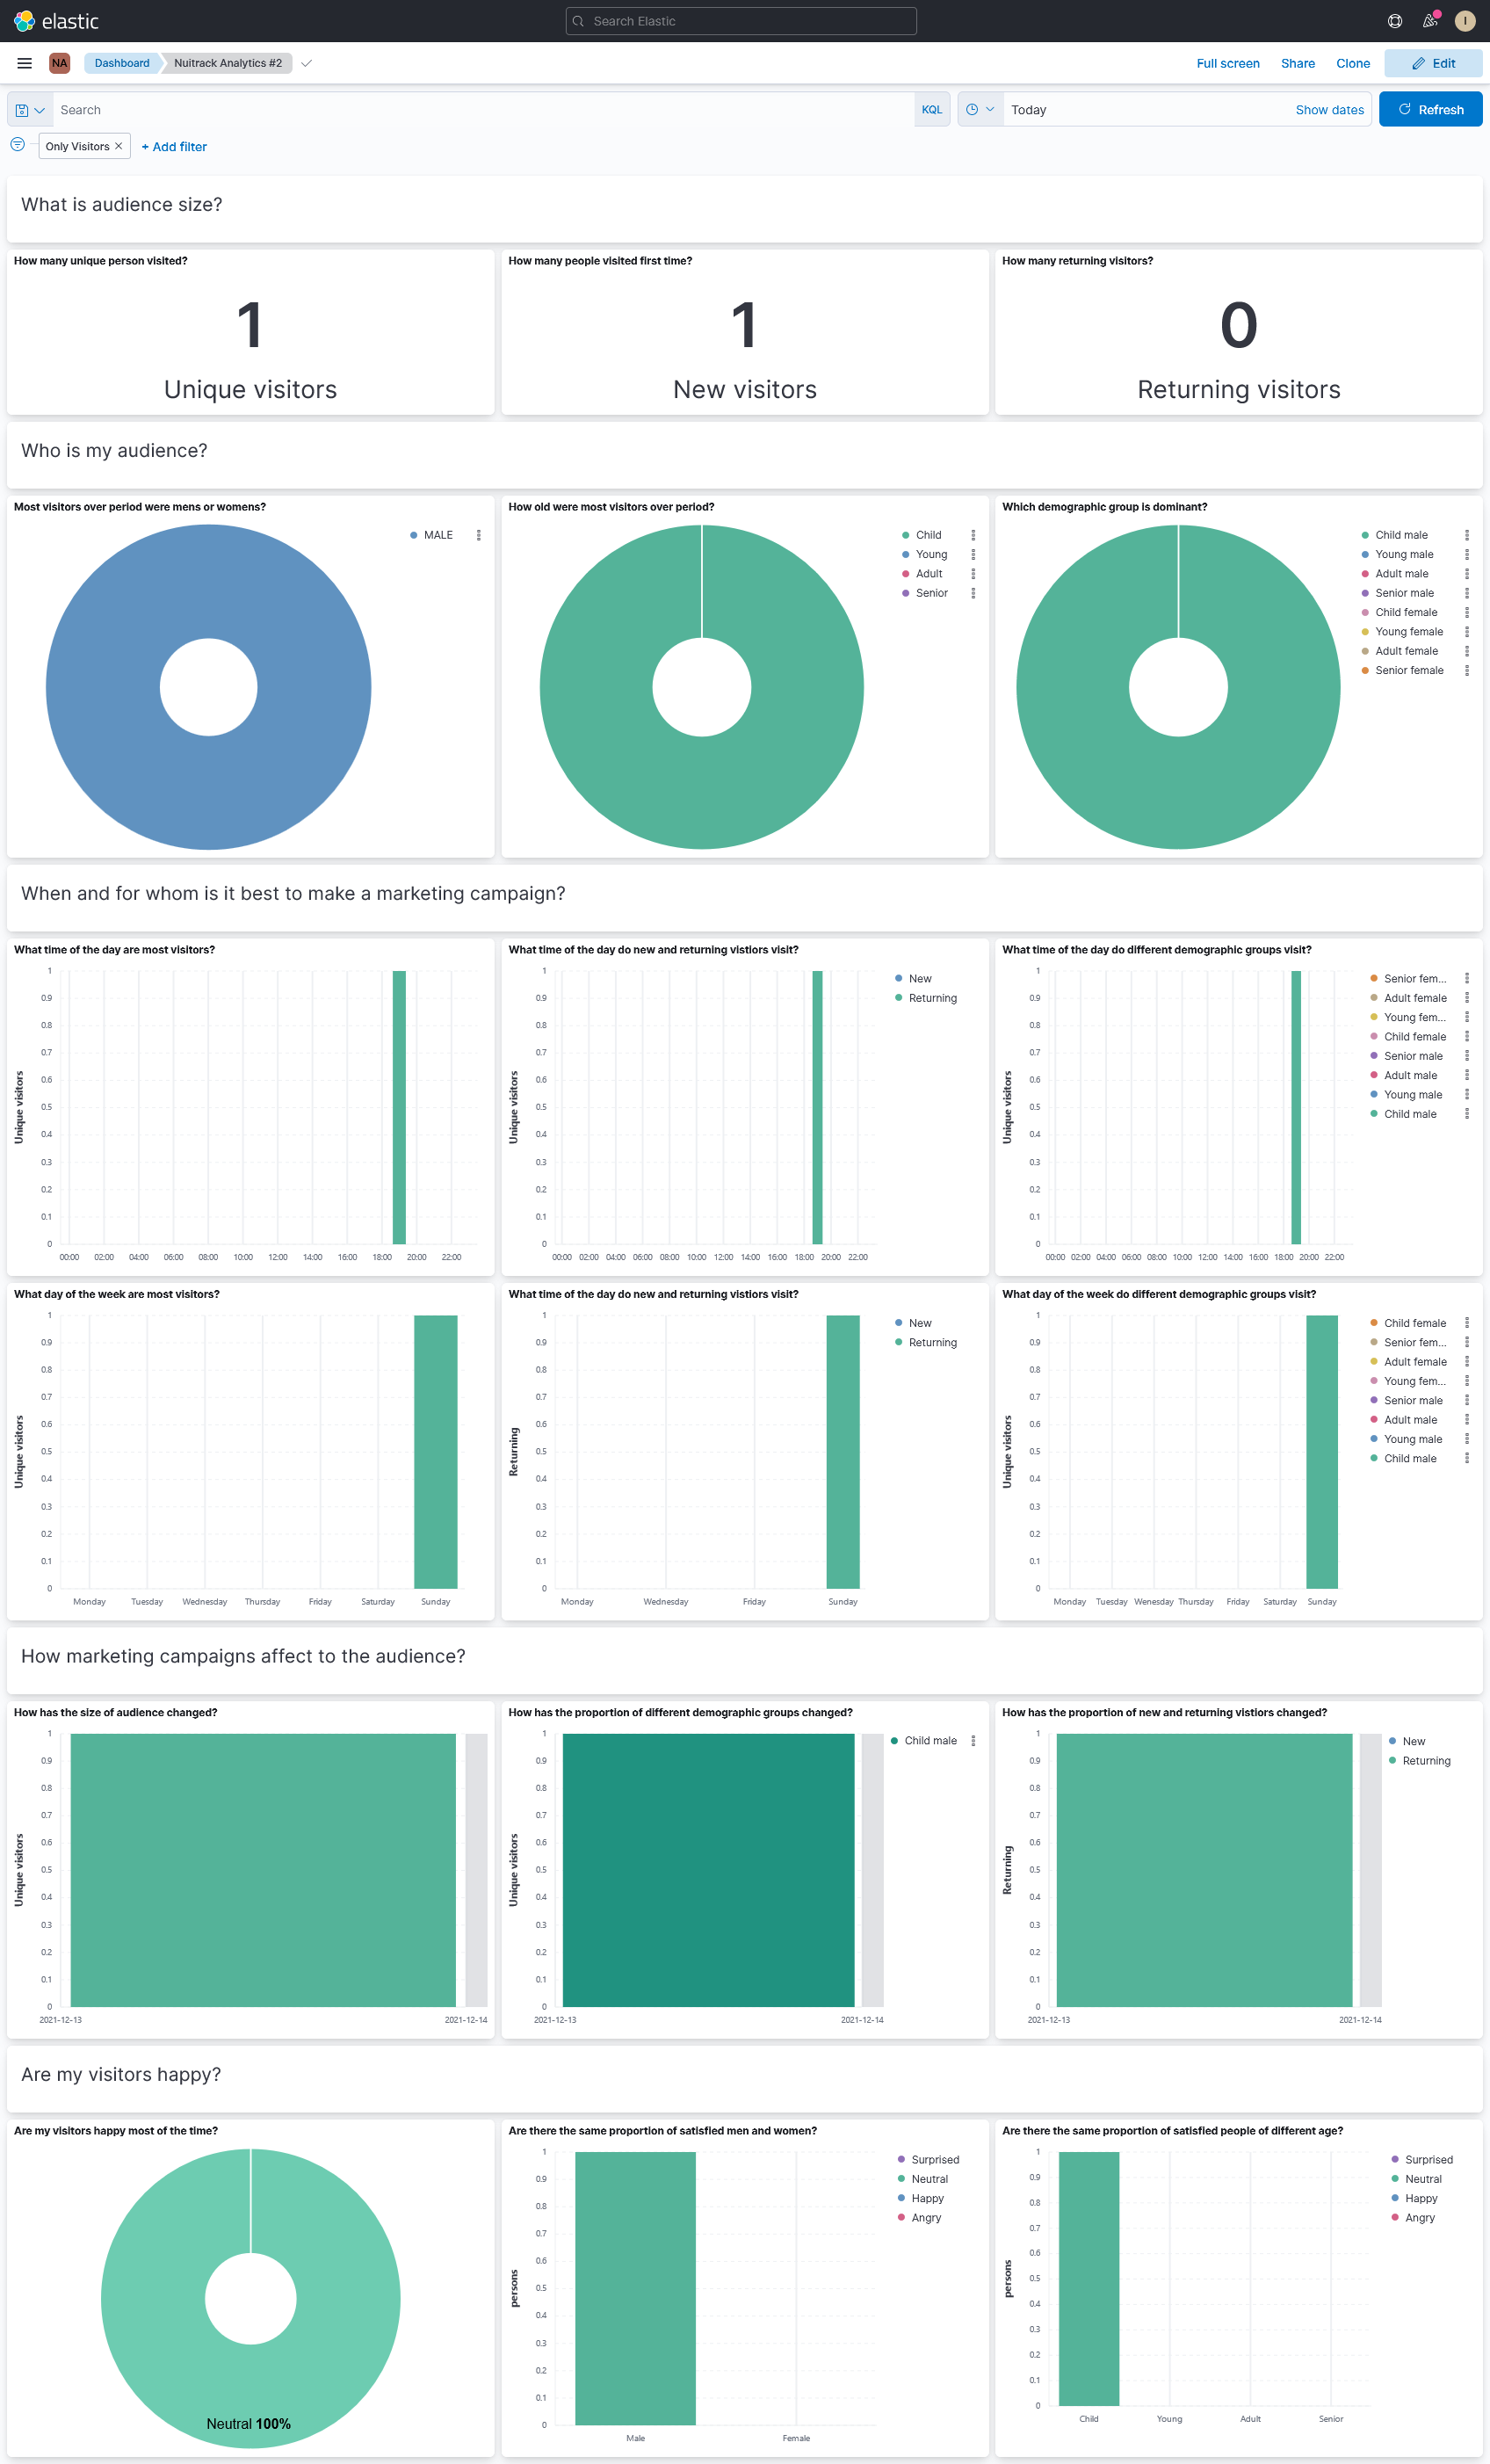
Go to "Editing" mode by clicking the "Edit" button in the upper right corner.
- Click on "Create visualization" button to add new visualization.
You have entered to the page for creating a visualization.
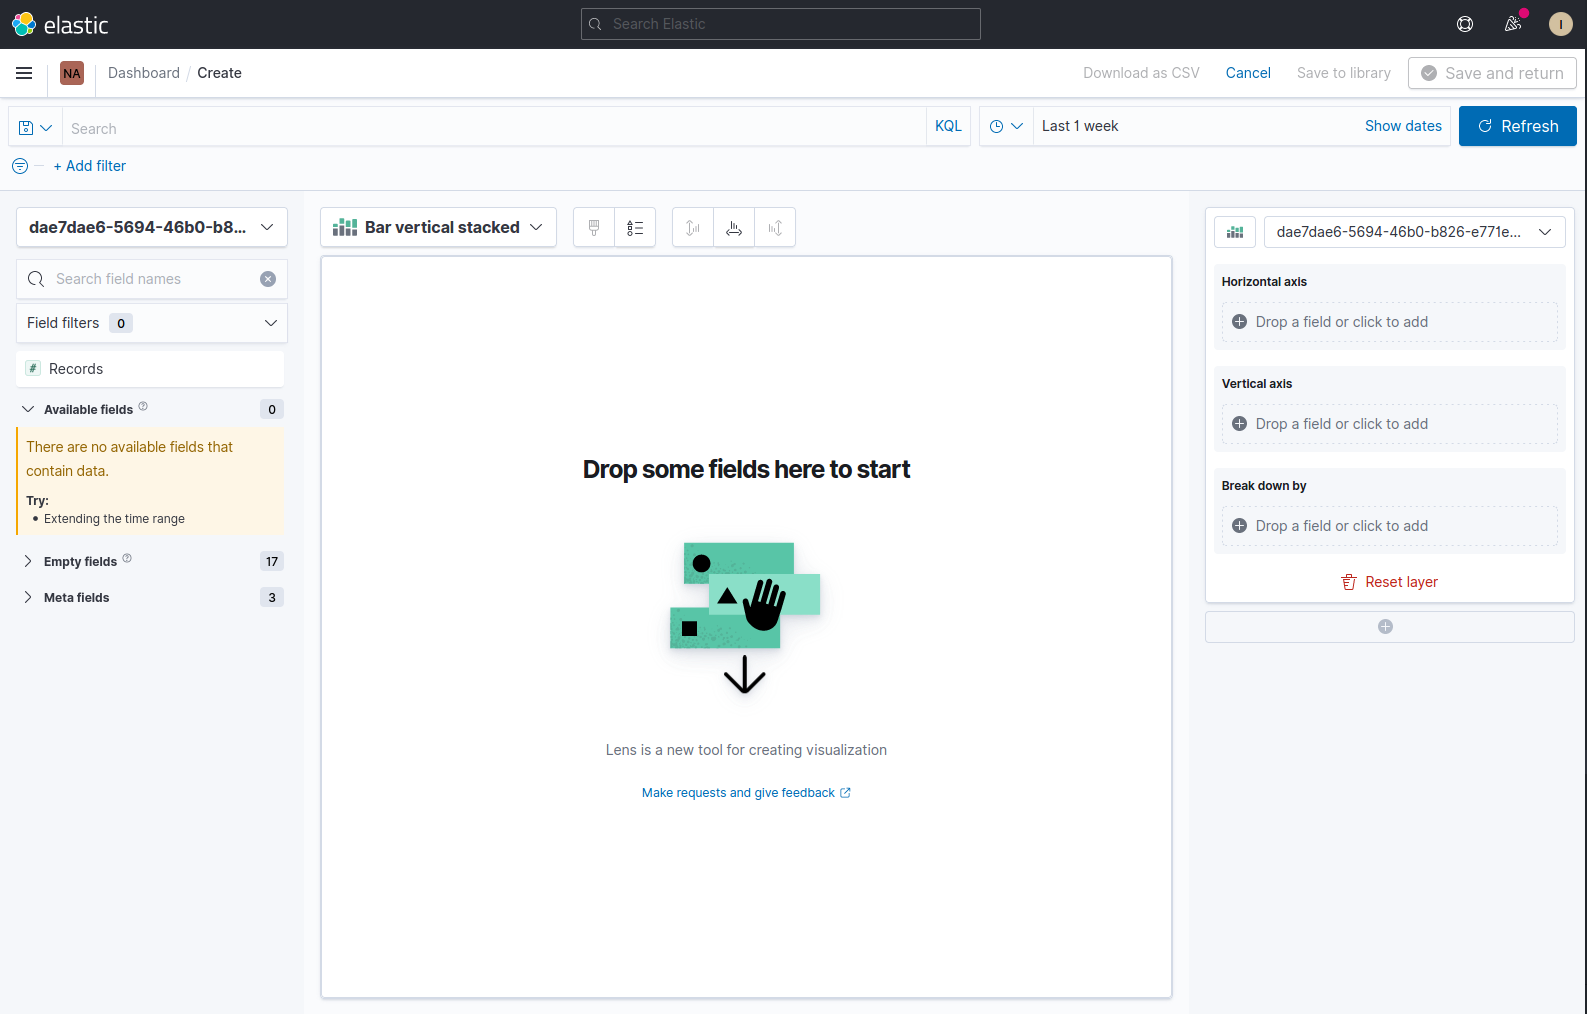
Add chart with the number of unique persons#
Configure the horizontal and vertical axis to display the chart with the number of unique persons.
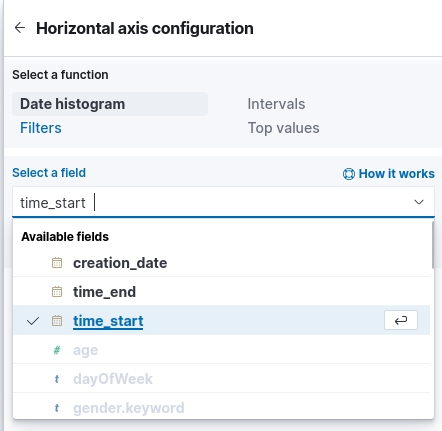
Click on the "Horizontal axis" field at the right sidebar, select "Date histogram" function and choose "time_start" field.
Enable the "Custom time interval" option, and set "Minimum interval" to one day.
Enter "time" into "Display name" field.
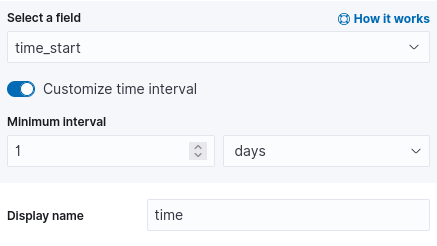
Horizontal axis is configured. Go back and configure "Vertical axis".
Select "Unique count" function, choose "person_id.keyword" field and set "Display name" to "person".
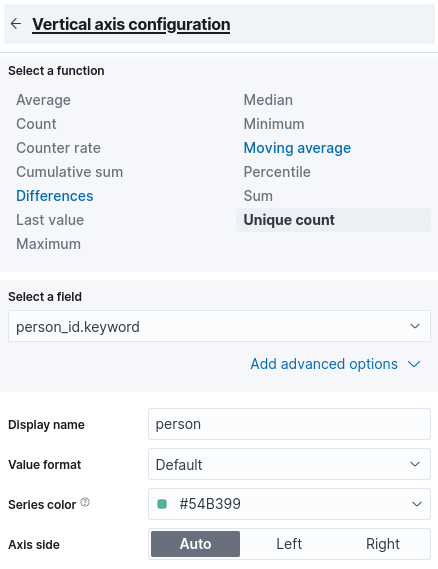
The vertical axis is configured. Your visualization should look like the image below.
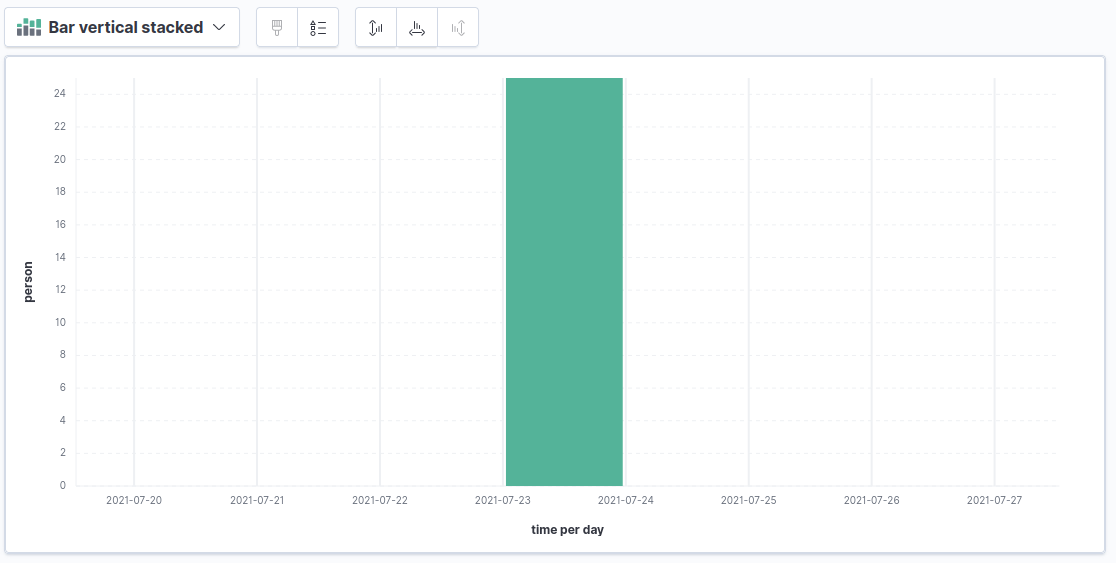
Add age groups split to the chart#
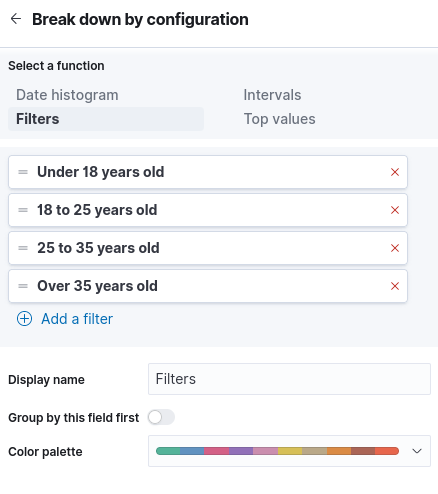
Use filters to split data for different age groups.
Click on the "Break down by" filed and select "Filters" function
Click on "All records" and eter the condition and label for the first age group.
Add additional filter for every age group.
Example of final chart shown below.
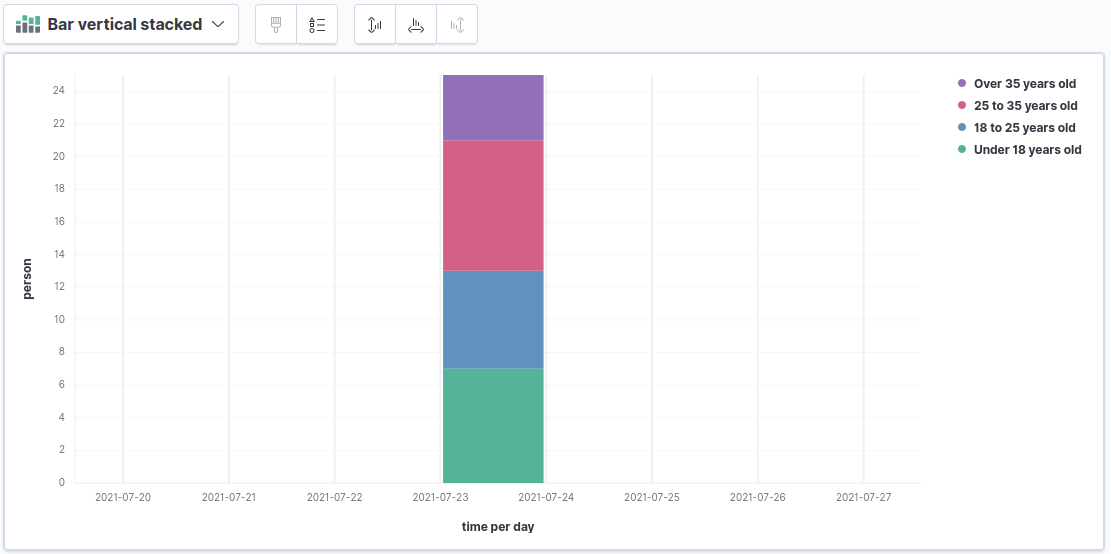
Save the graph and return to the dashboard, using the button in the upper right corner.
Add name to the chart by clicking on the "[No Title]" label at the left top corner of chart.
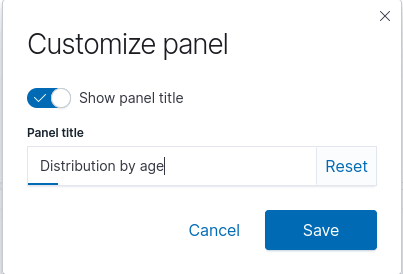
Save the changes and go to the view mode.
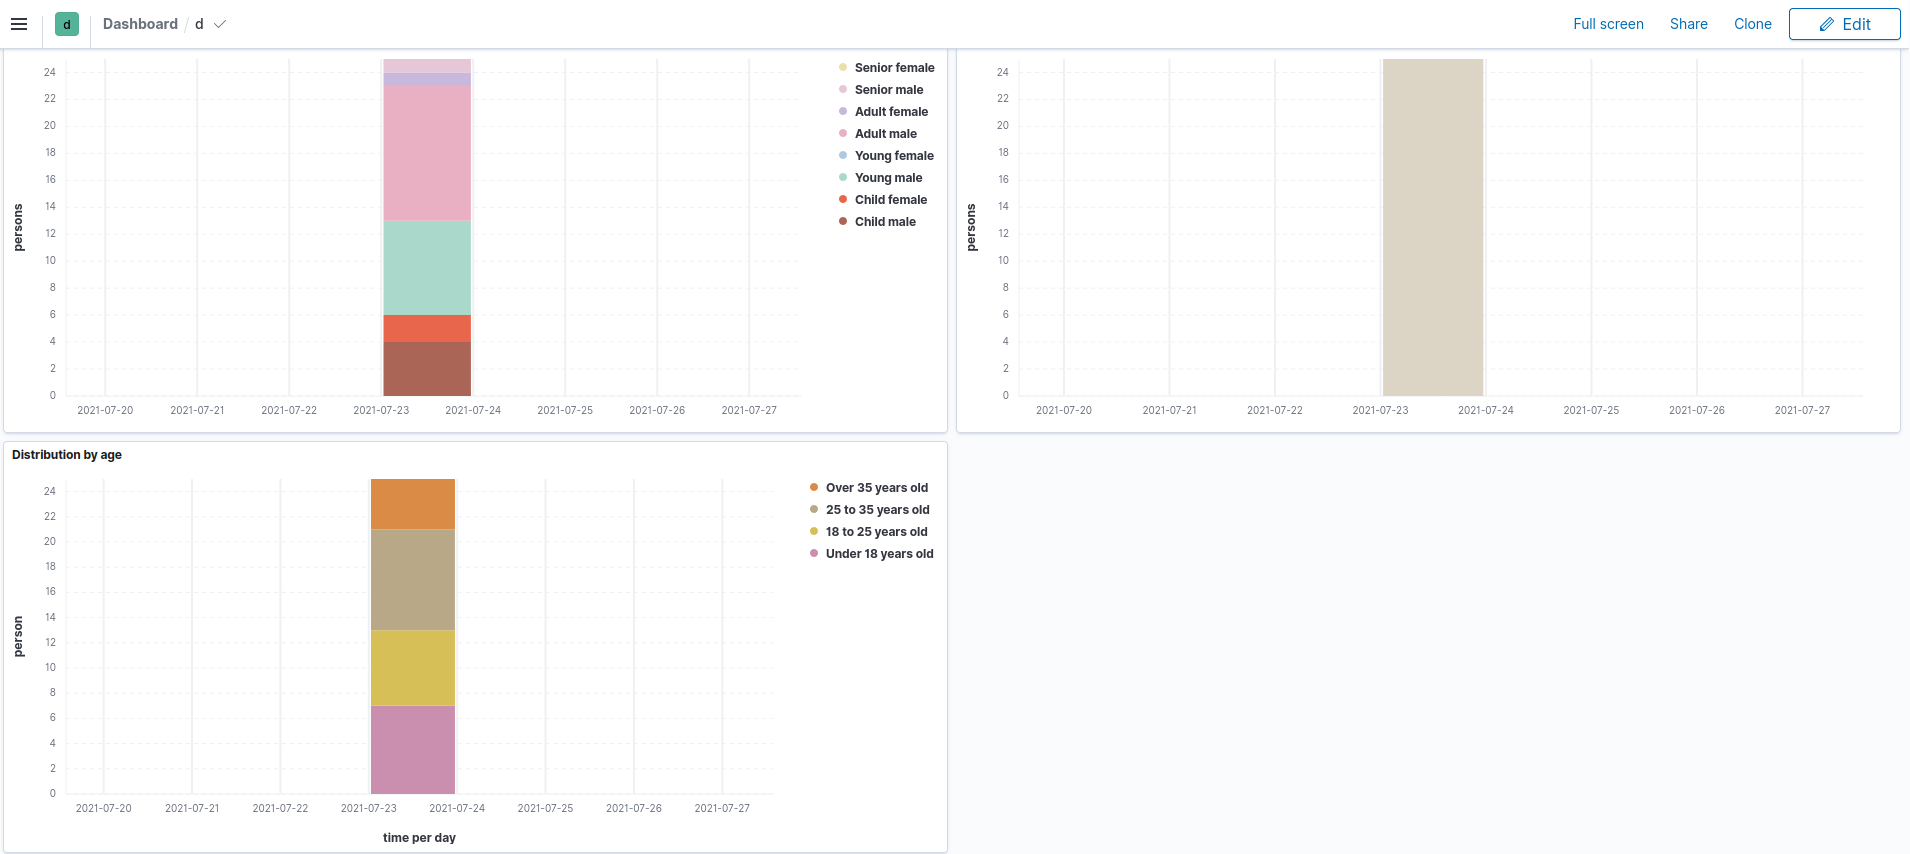
Congratulations! "Distibution by age" chart should be displayed on the dashboard.
What Next?#
See the list of available fields and official Kibana documentation to create visualizations for your needs.
List available fields
- id - unique activity identifier
- person_id - unique identifier of the person to whom the activity refers
- time_start - date and time when activity begins
- time_end - date and time when the activity ends
- age - person's age
- gender - gender of person
- creation_date - activity creation date
- emotion_name.time_start - date and time when emotion start
- emotion_name.time_end - date and time the emotion ends
